Stuck?  support@mecway.com
support@mecway.com
Mecway
FEA
Contour plot

Im frequency analisys, if I see a contour plot from one side I can see that colours represent values ranges. Per example those z displacement plots:

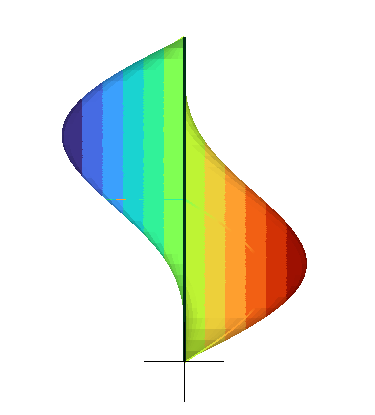
But if I sum z displacement of two modes I get this plot

but sideways I don't see that colours represent displacement ranges.

What is happenong here?
Is that colour plot wrong, or colours represent something different than range values of the variable?
But if I sum z displacement of two modes I get this plot
but sideways I don't see that colours represent displacement ranges.
What is happenong here?
Is that colour plot wrong, or colours represent something different than range values of the variable?
Howdy, Stranger!
It looks like you're new here. If you want to get involved, click one of these buttons!
Comments
If you created a new solution variable for that, then it won't be used for the deformed view by default but you can set it in Solution -> Deformed view settings.
If you modified the existing displacement variable with a script, there might be a cache that's not updated so perhaps re-open the file. If this happened, please let me know so I can fix it.
Is there a way to show a plot whose deformation is the variable I calculate instead of the displacement of the original mode?