contour plot not behaving as expected for contact stress pressure (and some others)
Hi,
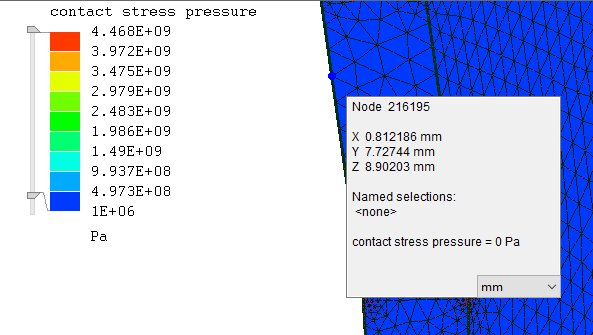
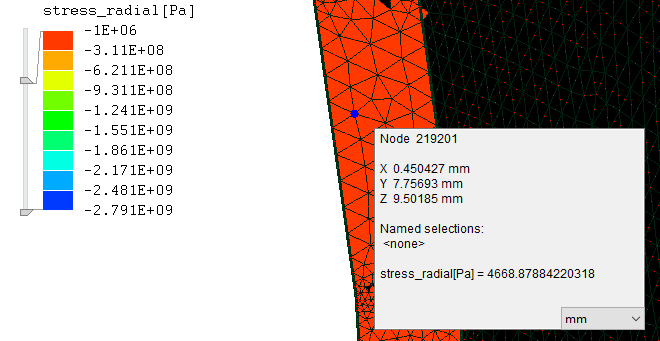
I've been doing some work for a cylindrical interference fit and have been looking at the contact stress pressure as one of the results. I'm aiming to get a patch of contact that is above a certain amount of pressure, I've also been using the radial stress at the surface as another indicator. Setting the minimum and maximum of the contour plot is normally how I would get a visual indication of this, with areas that are outside the bounds being shown in black.
But when I use this technique I get some potentially misleading images.
For example, with the contact stress pressure I try setting the minimum to be +1 MPa

Or with radial stress I set the maximum to be -1 MPa

I'm sure I've had both plots working as I expected previously. Maybe I've changed a setting somewhere?
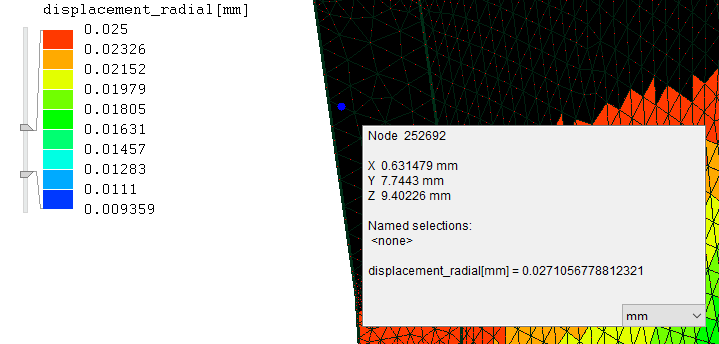
It works as I'd expect with other results, such as the displacement

I've experienced this issue with v17.0 and have just tried v18.0, which I used to produce these screenshots.
Has anyone got any pointers as to what I might be doing wrong? Or is this an issue with Mecway?
I've been doing some work for a cylindrical interference fit and have been looking at the contact stress pressure as one of the results. I'm aiming to get a patch of contact that is above a certain amount of pressure, I've also been using the radial stress at the surface as another indicator. Setting the minimum and maximum of the contour plot is normally how I would get a visual indication of this, with areas that are outside the bounds being shown in black.
But when I use this technique I get some potentially misleading images.
For example, with the contact stress pressure I try setting the minimum to be +1 MPa

Or with radial stress I set the maximum to be -1 MPa

I'm sure I've had both plots working as I expected previously. Maybe I've changed a setting somewhere?
It works as I'd expect with other results, such as the displacement

I've experienced this issue with v17.0 and have just tried v18.0, which I used to produce these screenshots.
Has anyone got any pointers as to what I might be doing wrong? Or is this an issue with Mecway?
Howdy, Stranger!
It looks like you're new here. If you want to get involved, click one of these buttons!

Comments
Thanks for taking a look at this. Sorry for not replying sooner.
WRT high vs low resolution - I've just tried increasing the resolution, with no visible difference on the affected area. If I click on each visible node for an element then I can see, for example, they all show a value of zero but the element is coloured as per the minimum which is set to 1e6. And the visible nodes around that element too.
But... with the resolution set high there are some black patches appearing. Much smaller than I'd expect and not including the node and elements I just examined.
A further confusion is that a lot of elements don't have contact defined, and yet according to the contour plot they have non-zero contact stress pressure, coloured as above 1e6 in the above example.
With the resolution set high I've just tried increasing the minimum for the contour plot up to 1e7 and now much more of the model is showing black; the only areas remaining coloured are the areas I expect there to be contact.
I'll have to have a chat with my client about sending this file. If I get a chance then I'll try to replicate the problem in a completely fresh model and avoid that issue altogether.
I've just found that if I reduce the maximum limit for the contour plot then I start to get plots closer to what I expected, at the lower end. Even with the lower resolution. If I let the maximum value go above ~1e9, with minimum set to 1e6, then the minimum colour starts to be applied to values below the minimum.
Could it be a rounding / quantisation type issue with the colouring?
You're absolutely right. I've managed to reproduce it now. There is a fudge which causes a relatively small spillover of color outside the specified range. Normally, it's not visible but when you're looking for a difference of 10^3 in a total range of 10^9, it's a problem. I'll fix this or at least reduce its effect.
This means I can cross replicating the problem off my to do list.
There's no great urgency as far as I'm concerned now that I've got a work-around.
Thanks for looking into this and working on it.
That seems to have dealt with the problems I was having, thank you. I appreciate that you indicate it might happen again but I'll work around those as and when.